Archive for the ‘Data analysis’ Category.

Metaanalyse zur prädiktiven Validität von Studierfähigkeitstests

Diese Woche erschien “Leisten fachspezifische Studierfähigkeitstests im deutschsprachigen Raum eine valide Studienerfolgsprognose? Ein metaanalytisches Update” (Post-Print bei ResearchGate). Als Erstautor bin ich darüber natürlich in erster Linie erfreut. Die Arbeit ist praktisch die Fortschreibung (bis 2018), Bestätigung (der prädiktiven Validität) und Erweiterung (mehr Fachrichtungen, inkrementelle Validität bzgl. Abinoten) der Metaanalyse von Hell, Trapmann und Schuler (2007). Ich möchte an dieser Stelle kurz ein paar zusätzliche Gedanken festhalten, die insbesondere die Entscheidungen betrifft, die man beim Schreiben eines Artikels unweigerlich treffen muss.

Die neue Metaanalyse orientiert sich stark an der alten, ist aber keine sklavische Wiederholung. So wurde anno 2019 als Software R verwendet. Das ist bei Validitätsmetaanalysen nicht unbedingt geradlinig. Ursprünglich hatte ich vor, das Paket psychmeta zu verwenden. Für die anschließenden Moderatoranalysen sowie für den Fokus auf Fixed-Effects-Modelle war am Ende aber metafor das Paket der Wahl, das die Analyse “im Stil” der Methode von Hunter und Schmidt vornimmt.

Es gab die Überlegung, die Studien der Hell-Metaanalyse auch in die Analyse mit einzubeziehen. Dann wäre die neue Arbeit aber nicht so eigenständig ausgefallen. Vielleicht nimmt sich in Zukunft ja jemand der Aufgabe an, alle Studien (seit 1980?) zusammenzufassen. Wir haben nicht zuletzt dafür die Datenmatrix unserer Analysen online gestellt, um möglichst transparent und replikabel (?) zu sein.

Die Betrachtung der inkrementellen Validität von Studierfähigkeitstests über die Abinote hinaus war mir wichtig, weil das Thema in der Praxis sehr präsent ist. Die Vermutung von Hell, Trapmann und Schuler (2008), dass es ein Inkrement im hohen einstelligen Prozentpunktbereich gibt, konnte numerisch bestätigt werden. An der Herausforderung der inferenzstatistischen Prüfung bin ich allerdings gescheitert. Deshalb fällt der Inkrement-Punkt im Artikel eher knapp aus. Ich bin auch skeptisch, dass es eine Spezialform des Wald-Tests gibt, die den Test mit den spärlich vorhandenen Daten rechnen könnte. Vielversprechender wäre eine Metaregression, für die aber in den Primärstudien die vollständigen Korrelationsmatrizen (mit Abinoten, Testleistungen und Studiennoten) berichtet werden müssen – was bislang nur in selten passiert ist. Dies ist also Zukunftsmusik.

Fazit: Ungeachtet dieser Punkte sehe ich die Arbeit positiv und die Ergebnisse als belastbar an. So freue ich mich auch auf die große, positive Resonanz auf unsere Metaanalyse, die es jüngst bei der DPPD-Fachgruppentagung sowie bei der BMBF-Fachtagung zu Eingangstests gab. Mal sehen, wer 2031 die nächste Metaanalyse zum Thema macht!
Accuracy, Readability, and Mplus

The idea to create an algorithm that automatically scans scientific articles for the results of common statistical tests and evaluates the accuracy of these results seems straight-forward. Statcheck performs this, well, stat check. Now a lot of available papers have been automatically evaluated and the outcomes were posted on PubPeer.

So far, none of the (two) papers on pubpeer I co-authored raised an error flag. That’s reassuring. I went and (stat)checked my other publications, and behold: There was indeed an inconsistency in one of them. In Schult et al. (2016) I reported “chi-square(33) = 59.11, p = .004″. Statcheck expected p = .003. The cause of this discrepancy is the rounding of rounded results. The Mplus output showed a chi-square value of 59.109 and a p value of 0.0035. I rounded both values to make the results more readable, accepting that, for example, a value such as 0.00347something would be mistakenly rounded to 0.004 instead of 0.003. For the record: Whenever a test statistic’s p value is close to the chosen alpha level, I do use all available decimal places to evaluate the decision of statistical significance. Of course, I could just report all available digits all the time. Still, that smells of pseudo-accuracy, plus I like to think that I write for human readers, not for computer algorithms.

What’s the take home message here? I won’t be surprised when this error/discrepancy/inconsistency (what’s in a name?) is discovered and posted by the big machine. I will keep writing my papers with care, double-checking the results etc. (something my senior authors always condoned and enforced). And did I mention that I put replication materials online (unless privacy/copyright laws or, sadly, busyness prevent me from doing so)?

Vlogbrothers View Statistics

Scroll down for nice plots! Watch the video here!

This is a summary of the YouTube statistics of videos by the Vlogbrothers – Hank and John Green. The raw data were kindly provided by kitchensink108.tumblr.com. I focus on two dependent variables:

  • Who made it? Hank-only, John-only, or both?
  • The second variable of interest is the Date. In other words: When was the video put online?

The data set already contains a few interesting variables:

  • The view count (Views)
  • The number of Likes
  • The number of Dislikes
  • The number of Comments

The three latter numbers co-vary (all rank correlations > .7) with the total number of views, so looking at them all separately would be repetitive and boring. So instead I will look at:

  • The view count – most of the time I’ll plot the natural logarithm of the view count because of a few outliers (more on those later)
  • The Likes per View ratio (overall appreciation)
  • The Likes per Dislike ratio (unambiguous appreciation)
  • The Comments per View ratio along with the overall number of comments
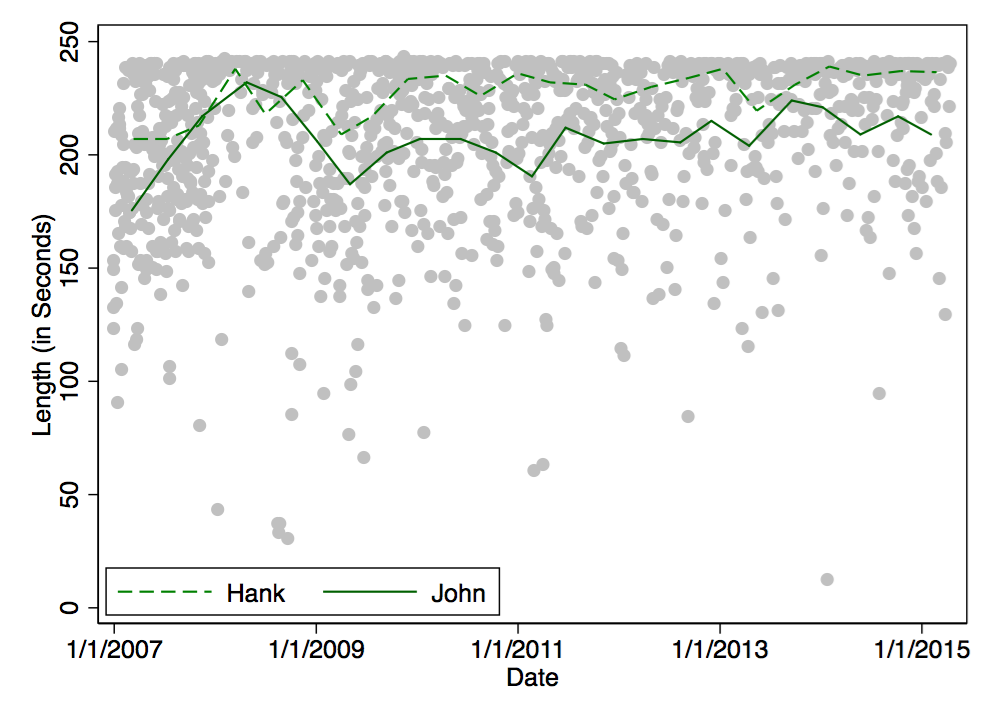
  • The length of the videos is not that interesting because most clock in just under 4 minutes. (NB: Longer videos were not included in the original data set.) There is just not enough variation. So I’ll just have one quick plot at the end.

Speaking of plots, most of the analysis will be graphical. This is pretty much a census, so there’s no need for statistical testing. Also, it’s all quite exploratory.


Here we go: Who tends to have more Views?

Here is the median view count for each brother: Hank: 256k, John: 286k, both: 347k. This means that 50% of Hank’s videos have more than 256k views, and the other half of his videos have less than 256k views. So John’s videos tend to get more views, but still less than reunion videos. You can also look at the means (M) and standard deviations (SD) – but there are some influential outliers that impede the interpretation of the numbers (Hank: M = 378k (SD = 537k); John: M =467k (SD = 1112k); both: M =367k (SD = 183k)).

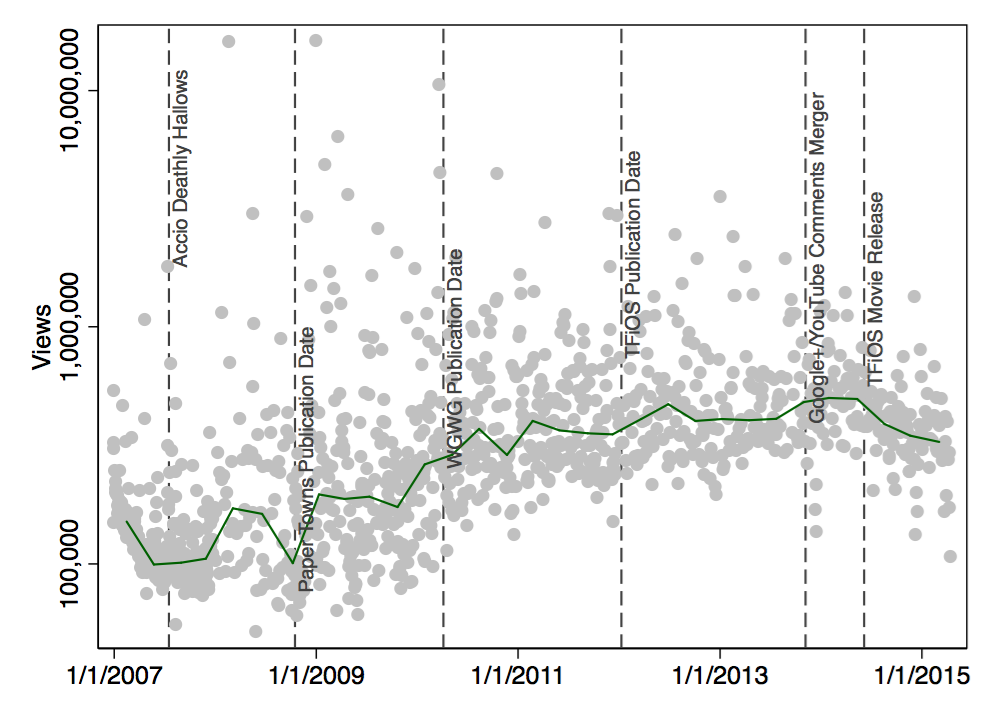
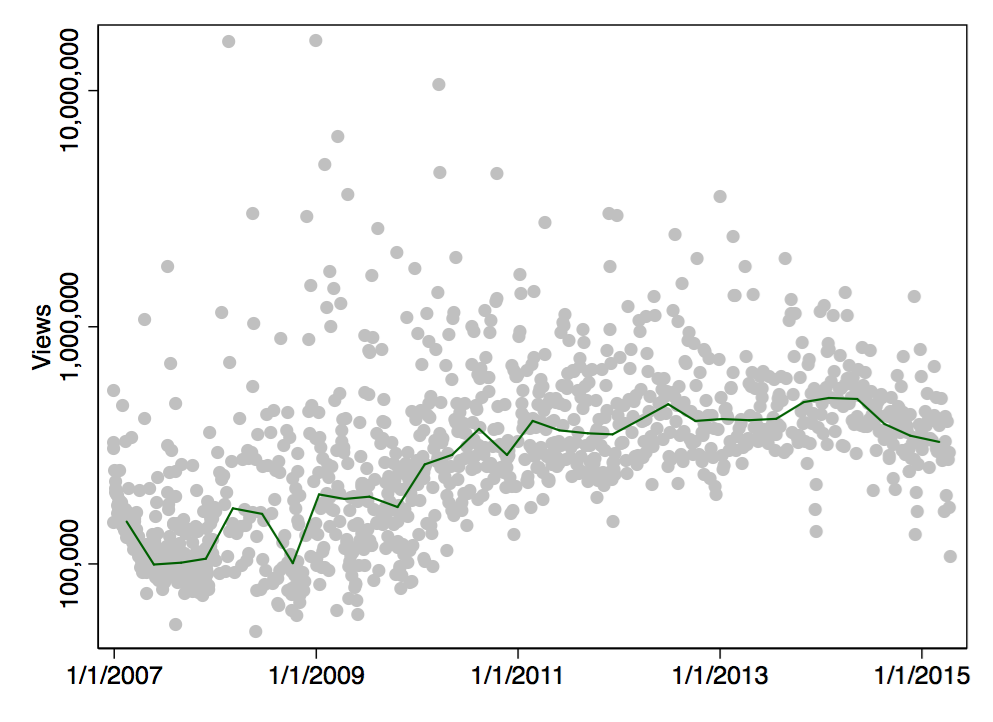
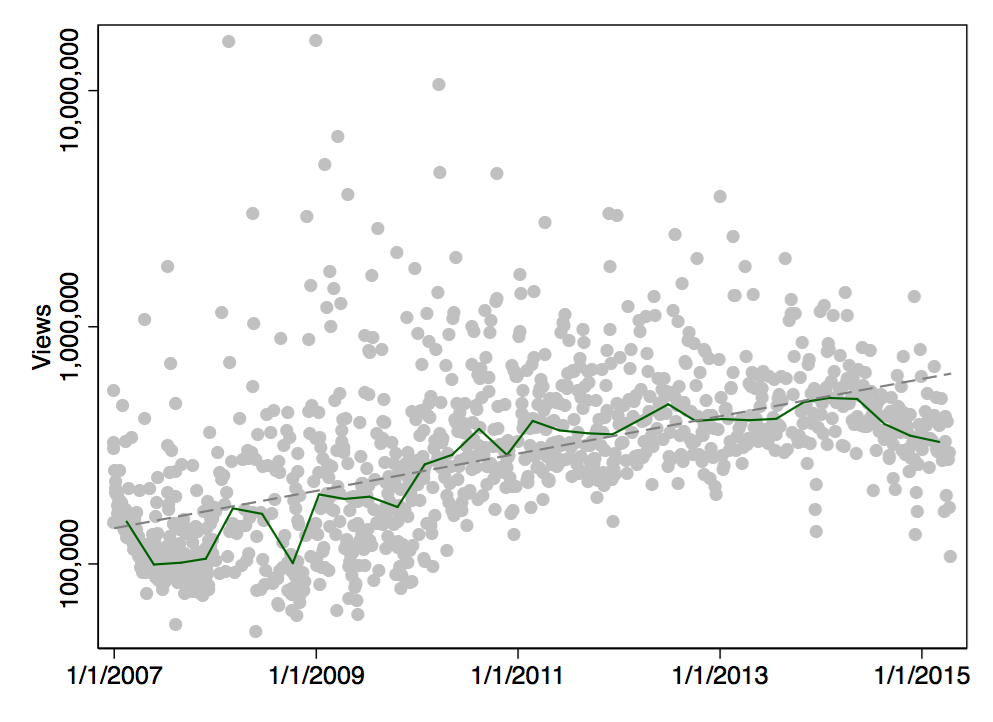
This plot shows the view count changes across time. The solid line is a median band. It indicates how many views a video needs at a given point in time to have less views than half of the other videos.

Scatter Plot: ln(Views) by Date

Each gray point represents one particular Vlogbrothers video. When I add the linear trend (actually, it’s a log-linear trend), it becomes clear that newer videos tend to get more views:

Scatter Plot: ln(Views) by Date

And this is the same plot with some additional Nerdfighter-related dates:

Scatter Plot: ln(Views) by Date

Did the movie version of The Fault in Our Stars lead to fewer views? I don’t think so – this is mostly speculation, anyway. There could be many reasons why Nerdfighters might be watching fewer videos (CrashCourse, SciShow, Tumblr, jobs, kids). Personally, I think that the more recent videos just haven’t accumulated as many views from new nerdfighters who go through old videos (and from random strangers).

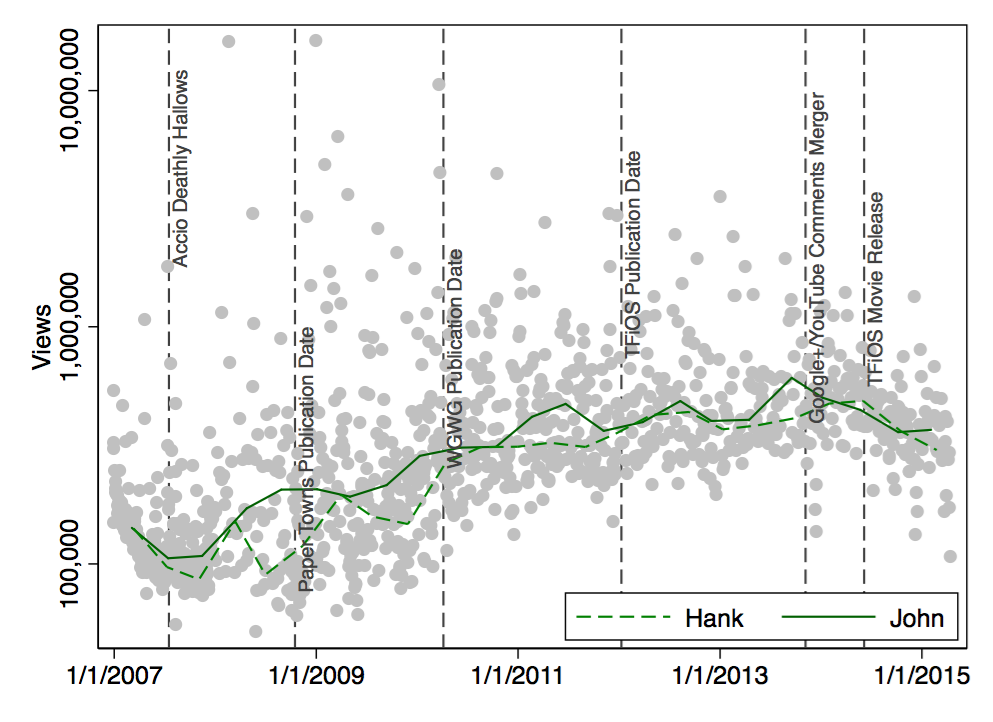
Here is another version of this plot, this time with separate lines for John and Hank:

Scatter Plot: ln(Views) by Date

My interpretation would be that the view counts of Hank and John didn’t really develop differently.


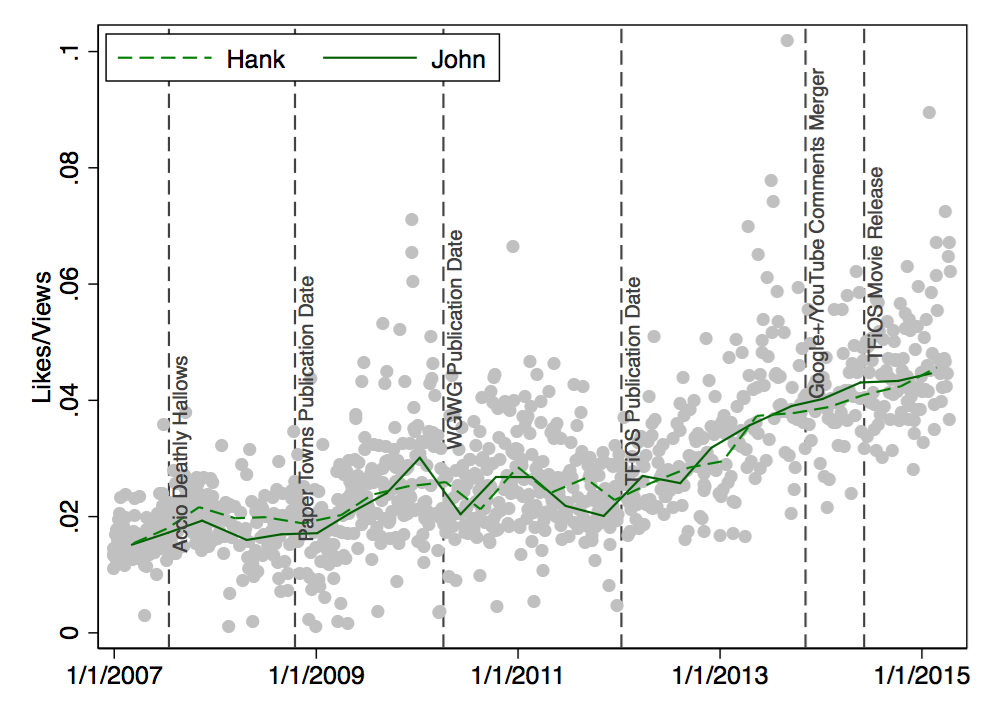
So far, so good. Now what about actual appreciation? When I look at the median values for Likes per View, Hank’s videos are liked by 2.3% of viewers. John’s videos are liked by 2.2% of viewers. Reunion videos are liked by 3.3%; Nerdfighters seem to like reunion videos!

Here’s the longitudinal perspective – again no clear differences between Hank’s videos and John’s videos:

Scatter Plot: Likes/Views by Date


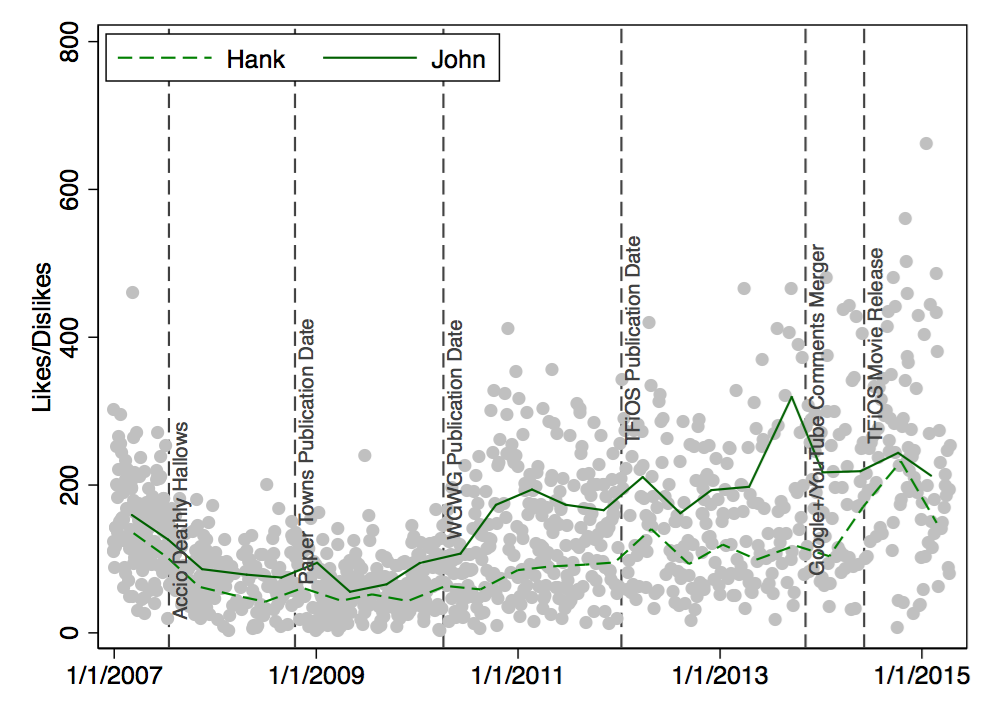
Being liked is one thing. But how about the Likes per Dislike ratio? Here are the median values: Hank’s videos tend to get 78 Likes per Dislike. John’s videos tend to get 126 Likes for each Dislike. And reunion videos trumps them both with a median of 177 Likes per Dislike. Here’s the longitudinal perspective:

Scatter Plot: Likes/Dislikes by Date

There were even more Likes than Dislikes during the past few years. This development occurred especially for John’s videos.


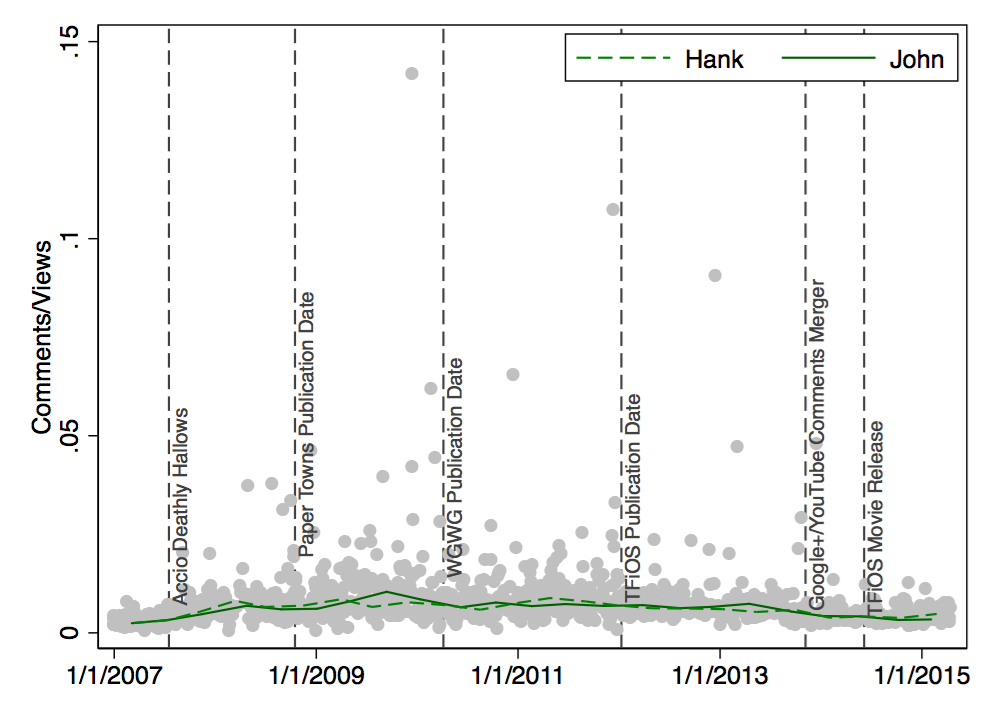
Enough with the appreciation – how about Comments? An eternal source of love, hate, fun, and chaos they are. The overall tendency (i.e., median) is that 0.5%-0.6% of viewers write a comment. Let’s look at the longitudinal perspective of Comments/Views:

Scatter Plot: Comments/Views by Date

The number of Comments per View has declined over the past two years; possibly due to the integration of Google+ and YouTube or the new sorting algortihm for comments.


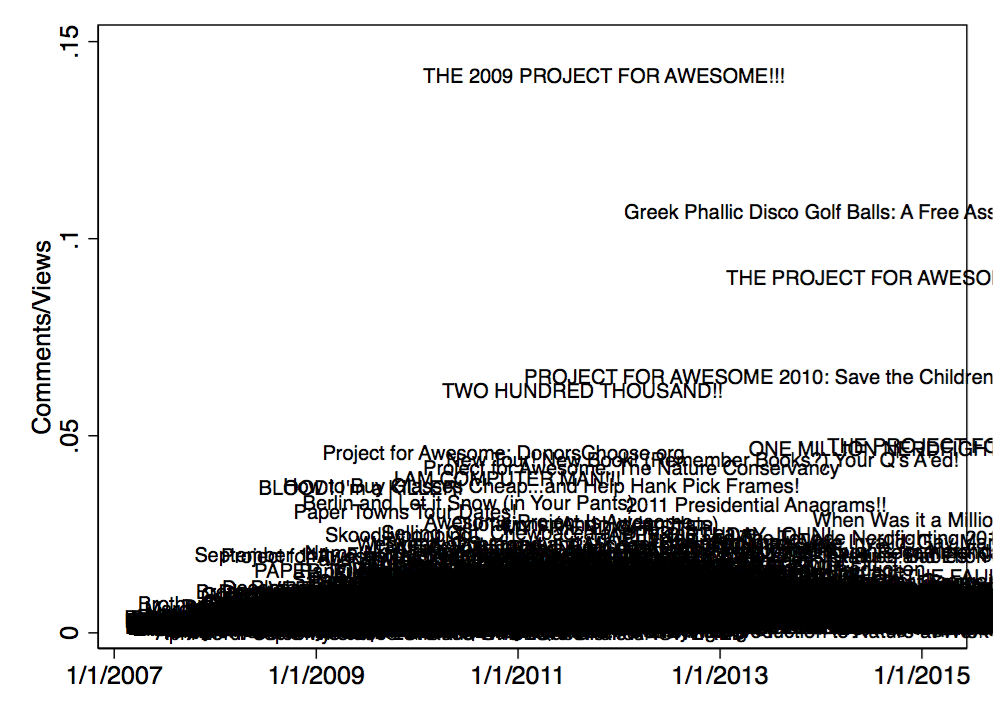
Finally, here’s a quick overview of specific types of outliers. Videos that elicit a lot of comments are mostly about the Project for Awesome:

Scatter Plot: Comments/Views by Date

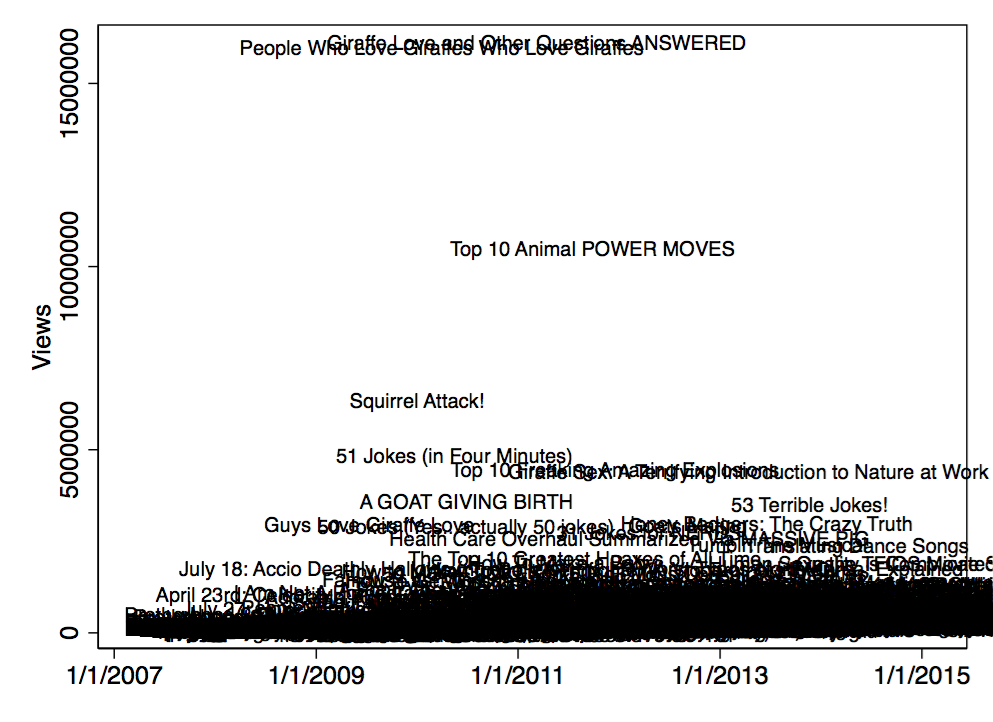
The videos with the highest view count all deal with animals:

Scatter Plot: Views by Date (with titles)

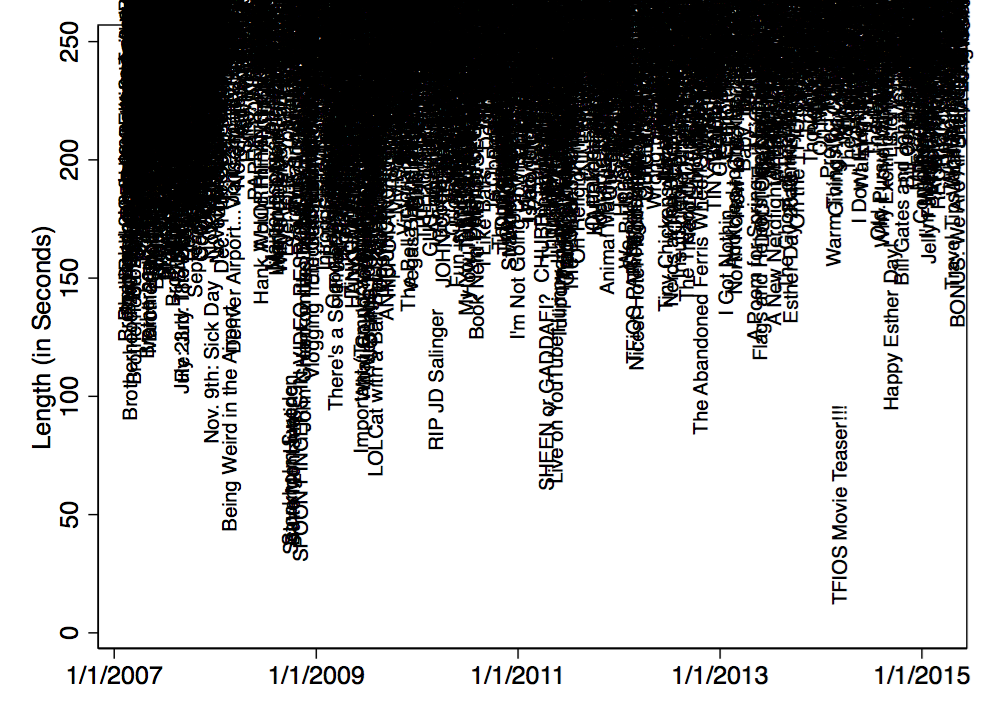
The last couple of plots brings us back to the length of the videos. Here are the titles of the shorter videos.

Scatter Plot: Length by Date (with titles)

Not much to say here. And it seems as if Hank keeps making slightly longer videos than John:

Scatter Plot: Length by Date (by Vlogbrother)

That’s all. DFTBA!

PS a day later: I turned this post into a video. The initial text along with the analysis commands are listed in this Stata do-file.

Woher wissen Sie das alles eigentlich?

Part of my job is statistical consulting. Recently, I explained the use of plausible values in PISA to someone, who then asked me a question I found very interesting: “Where did you learn all this?” I really liked this question, because it goes beyond the search for a particular solution to a particular problem. So now I resolved to ask it myself more often when I get advice from others.

Estimating the Release Date of Richard Shindell’s Next Album

Richard Shindell has been working on his next album for quite some time now. His fans (that includes me) try to be patient. Several new songs have already made their live debut. The album is supposed to be called “Viceroy Mimic” (VM), but a couple of weeks ago he also mentioned “Same River Once” as a contender. Pressed about a release date, Shindell said (during a recent concert in Boston) January 2015. Regardless of this, here’s the statistical perspective – just for fun! The linear trend across all album releases (including live albums, cover albums, Cry, Cry, Cry etc.) suggests that a new album should have been released on November 4, 2013.

Graph: Linear prediction of the release dates of Richard Shindell albums (incl. live albums etc.)

The quadratic trend across Richard’s original studio albums, however, would imply a May 11, 2014 release date for “Viceroy Mimic”. The linear prediction appears to be worse in this case; it the lag between original albums is increasing.

Graph: Quadratic prediction of the release dates of Richard Shindell albums (only original studio albums)

Given the projected 2015 release, a cubic function might be necessary, soon. Anyway, below you can find the detailed data and the Stata code to replicate the graphs.

Continue reading ‘Estimating the Release Date of Richard Shindell’s Next Album’ »

Konferenz-Gedanken

Zum Ende der 2. GEBF-Tagung in Frankfurt habe ich ein paar Überlegungen festgehalten. Sie beziehen sich nicht zwingend auf die konkrete Konferenz, die insgesamt sehr kurzweilig war (und u.a. Kekse beinhaltete).

  • Alle Pausen (mindestens) 30 Minuten lang machen! Redezeiten werden überzogen, man geht zur Toilette, man deckt sich mit Kaffee und Keksen ein, bisweilen sind die Vortragsräume über verschiedene Gebäude verteilt – und es bleibt (bei 15-minütigen Pausen) kaum Zeit für Gespräche, Orientierung und Regeneration. (Im Zweifelsfall dafür eine Keynote weniger ins Programm nehmen.)
  • Hilfskräfte mit Wasserpistolen ausstatten, die immer dann zum Einsatz kommen, wenn ein Redner die Zeit überzieht! Ich fände es auch sinnvoll, eine Datenbank mit der Vortragsdauer (bzw. der jeweiligen Abweichung von der vorgegebenen Redezeit) anzulegen, damit bei zukünftigen Tagungen die “Überzieher” (Konferenz-übergreifend) identifizierbar sind.
  • Kekse anbieten! Zur Not die Teilnahmegebühr erhöhen.
  • Zum Starten von PowerPoint-Präsentationen F5 drücken! Ich persönlich wurde freilich das pdf-Format bevorzugen (bzw. ganz auf Folien verzichten). Bei Adobe Reader ist Strg+L die Vollbild-Tastenkombination.
  • Wer in einer Session zuletzt vorträgt, kann sich häufig die Einleitung sparen! Eine wiederholte Vorstellung der Konstrukte und Theorien ist redundant.
  • Vielleicht wäre es eine gute Idee, beim Tagungsbüro in der Nähe einen Stadtplan auszubreiten bzw. aufzuhängen, damit die Teilnehmer sich besser orientieren können (ÖPNV, Restaurants, Kneipen, Plattenläden).

Replicate My Work!

Scientific work requires transparency. There is no mad genius in his/her lonely tower working for years on end on some great invention. While it may be true that professors have little time for anything but their research, they communicate their findings (along with their methods). Science is a social enterprise. Primed by Gary King‘s essay “Replication, Replication” (1995) and lectures by Rainer Schnell, I arrived at the conclusion that a scientific workflow must be a reproducible workflow. I do think that making replication material broadly available is a good thing for everyone involved.

Replication materials for my recent publications can now be found online. Maintaining a reproducible workflow is hard work but rewarding. Looking back, I could have improved a lot of things (without changing the results, mind you). It felt a bit awkward at first. Soon enough it felt even more awkward to have waited so long to put up the material. I wish I could share more of my older publications (and also raw data) but privacy laws, work contracts, and fellow psychologists who are highly skeptical of these ideas keep me from doing so.

Hopefully, the present material is just the beginning. Sadly, most psychologists do not share their materials publicly so I had to figure out most stuff on my own. I decided against third-party repositories because some focus solely on data sets whereas others are somewhat difficult to handle. So I wrote the HTML by hand hoping that a plain format allows for longevity. Let me know if you have any suggestions for improvements.

Measuring the Popularity of Novels?

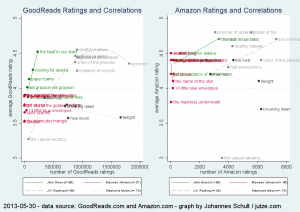
Apparently, the amount of ratings on GoodReads.com is highly correlated with the ratings, at least for John Green’s four novels (r = .96). But is it really ‘the more, the merrier’? I picked four more authors (in a non-random fashion), had a look at the respective correlations for their novels, and made a couple of graphs to illustrate the results.

Scatter plot of amount of ratings and ratings

Novels by John Green, Maureen Johnson, J.K. Rowling, and Stephanie Meyer

The relationship is a negative one for Stephanie Meyer’s books. Two books of J.K. Rowling are outliers – her first one in terms of ratings on GoodReads, her most recent one in terms of rating. I therefore took the liberty to plot a quadratic fit (instead of a linear fit). It appears that John Green might be an exception (like the Mongols?) Also, Amazon.com ratings tend to be higher; and again, there is no clear relationship between the amount of reviews and the average rating.

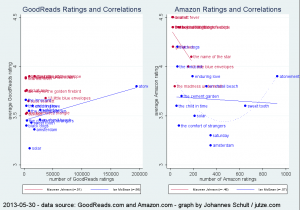
And since I recently finished reading “On Chesil Beach”, here’s the data for Ian McEwan’s novels, along with a more appropriately scaled plot for Maureen Johnson’s books:

Scatter plot of amount of ratings and ratings

Novels by Maureen Johnson and Ian McEwan

By the way, the correlation between Amazon.com ratings and GoodReads.com ratings for the 40 books I used above is r = .89. The correlation between number of Amazon.com reviews and Goodreads.com ratings is r = .75.

PS: If anyone is interested in the Stata code for the graphs, let me know. I guess, I’ll add it here this weekend, anyway, but right now I should go to bed.

Null Hypothesis Significance Testing: The Fault in Our Stars

fishingboatproceeds

[…] The same is true on amazon, where the book’s average rating has actually gone up a bit in the past six months (although not in a statistically significant way). […]

Actually, the ratings have decreased in a statistically significant way (alpha < .05). I used the two most recently archived pages from archive.org, which do not cover exactly 6 months. Still, ratings before 2013-02-03 were higher than those after that date.

  • Before (2110 ratings): mean = 4.76 (SD = 0.014)
  • After (1232 ratings): mean = 4.67 (SD = 0.021)

A t-test (two-sided, unequal variances) yields p = 0.0009 (d = -0.12); and for the non-parametric fans, the Wilcoxon rank-sum (Mann-Whitney) test yields p = 0.0001.

Using 2012-10-19 as dividing date, yields similar results:

  • Before (1051 ratings): mean = 4.77 (SD = 0.020)
  • After (2291 ratings): mean = 4.71 (SD = 0.015)

A t-test (two-sided, unequal variances) yields p = 0.0188 (d = -0.09); the Wilcoxon rank-sum test yields p = 0.0008. Of course, significance testing might be a questionable procedure in this case – and also in general.

This is actually a census of all Amazon ratings, so there’s no need to test whether ratings differ. The sample is the population. However, the written reviews could be regarded as a subsample of the ratings of all readers.

Is it a random sample? I don’t think so. So can we draw proper conclusions from the significance test results? Nah. I won’t provide a comprehensive discussion of the benefits and problems associated with the null hypothesis significance testing (NHST). I’ll just name one of my favourite objections, which Cohen (1990, p. 1308) phrased nicely: “The null hypothesis, taken literally (and that’s the only way you can take it in formal hypothesis testing), is always false in the real world.” In the present, the null hypothesis would mean, that average rating of newer readers is exactly the same as the average rating of those who pre-ordered the book etc.

Anyway, the effect size suggests that the drop in ratings is very small, so it should be safe to argue that the book keeps appealing to new readers.

PS: Sorry for nitpicking; this should in no way diminish the article, which I think is highly insightful.

PPS: I spend a good 15 minutes in R trying to beat the data into shape, but I feel much more comfortable in Stata, so I switched and had the analysis in a few minutes. Here’s the do-file in case anyone in curious. (Haha, as if!)

Continue reading ‘Null Hypothesis Significance Testing: The Fault in Our Stars’ »

SpinTunes Feedback, Metal Influences, and Statistics

The first round of the SpinTunes #3 song writing competition is over. Lo and behold, I made it to the next round! So needless to say I’m happy with the results. But equally important, the reviewers provided a lot of feedback. One is often inclined to retort when faced with criticism. Musicians even tend to reject praise if they feel misunderstood. I’m no exception. But this time around I actually agree with everything the judges wrote about my entry. (I Love the Dead – remember?) There wasn’t even the initial urge to provide my point of view, shed light on my original intentions. I will now go into the details, before I turn to a quick statistical analysis of the ratings in the last section of this post.

The incubation period for this song was rather long. At first, I was considering writing about the death metal band Death. It would have meant stretching the challenge and alienating anyone unfamiliar with the history of death metal (read: pretty much everyone). The only reminiscence of heavy metal in my actual entry is the adaptation of Megadeth’s “Killing Is My Business and Business Is Good”. I toyed with the idea of celebrating the death of a person who has lived fully and left nothing but happy marks on the lives others. Translating this idea into an actual song was a complete failure, though. I also considered writing about mortality statistics. There’s people who estimate the space needed for future graveyards and health insurances and so on. I’m somewhat familiar with the statistics behind that. But it would have taken weeks to turn this into a cohesive songs. So I returned to the notion of the happy grave digger. (Yes, Grave Digger is the name of a German metal band.) The working title was “Grave Digger’s Delight”. The music started with the chorus while I was playing an older idea I hadn’t used so far. Basically, I threw away the old idea except for the initial G-chord and the final change to D. I did add the intro melody, more on that soon. The verses are the good, old vi-IV-I-V, but with a ii thrown in for good measure. That’s not too original, but I was already running out of time. The lyrics started out with a word cloud of related terms. Plots With a View was a big inspiration when it came to the sincerity behind the mortician’s word. Here’s a person who’s dedicated to his job! I had wanted to include a couple of fancy funeral descriptions. But the music called for more concise lyrics. All that’s left from that idea is the line “I can give you silence – I can give you thunder”, which I kept to rhyme with “six feet under”. That one is indeed very plain, but I felt that the huge number of competitors called for a straight song that brings its message across during the first listen, preferably during the first 20 seconds. I think I succeeded in this respect. (This also a major reason why I changed the title to “I Love the Dead” – keeping it straight and plain.) The 2 minute minimum length gave me headaches. This made me keep, even repeat, the intro melody. I was tempted to use a fade out. But I always see this as a lack of ideas. So I used the working title for the ending. Given a few more days I might have come up with a more adequate closure. Even as I was filming the video, I felt the need to shorten the ending. I tried to spice up the arrangement with a bridge (post-chorus?) of varying length. I wasn’t completely sure about it during the recording process, but now I’m glad that the deadline forced me to keep it as it is. At one point I had a (programmed) drum track and some piano throughout the songs. To me it sounded as if they were littering the song rather than filling in lower frequencies. So I dropped them and just used a couple of nylon-stringed guitars (one hard right, one hard left), a steel-stringed guitar (center), a couple of shakers, lead vocals plus double-tracked vocals and harmony vocals in the chorus (slightly panned) and, of course, the last tambourine.

TL;DR – I appreciate the feedback and I resolve to start working on my next entry sooner.

Russ requests statistics. I happily obliged and performed a quick factor analysis using the ratings. What this method basically does is to create a multi-dimensional space in which the ratings are represented. There is one dimension for each judge, yielding a 9-dimensional space in the present case. If everybody judged the songs in a similar way, you would expect “good” songs to have rather high ratings on all dimensions the “bad” songs to receive low ratings. A line is fitted into this space to model this relationship. If all data point (i.e., songs) are close to that line in that space, the ratings are supposed to be uni-dimensionally.  In other words, there appears to be one underlying scale of song quality that is reflected in the ratings. This would be at odds with the common assertion that judgments are purely subjective and differ from rater to rater. (It would also suggest that computing the sum score is somewhat justified and not just creating numeric artifacts void of meaning.)

Using Stata 10 to perform a factor analysis with a principal-component solution, I get the following factors:

. factor blue-popvote, pcf
(obs=37)

Factor analysis/correlation                    Number of obs    =       37
Method: principal-component factors            Retained factors =        2
Rotation: (unrotated)                          Number of params =       17

--------------------------------------------------------------------------
Factor   |   Eigenvalue   Difference        Proportion   Cumulative
---------+----------------------------------------------------------------
Factor1  |      4.44494      3.29466            0.4939       0.4939
Factor2  |      1.15028      0.33597            0.1278       0.6217
Factor3  |      0.81431      0.08112            0.0905       0.7122
Factor4  |      0.73319      0.19850            0.0815       0.7936
Factor5  |      0.53468      0.05959            0.0594       0.8530
Factor6  |      0.47510      0.11760            0.0528       0.9058
Factor7  |      0.35750      0.05932            0.0397       0.9456
Factor8  |      0.29818      0.10635            0.0331       0.9787
Factor9  |      0.19183            .            0.0213       1.0000
--------------------------------------------------------------------------
LR test: independent vs. saturated:  chi2(36) =  137.45 Prob>chi2 = 0.0000

Wait, what? Let’s just focus on one criteria for exploring the factor solution: Eigenvalues larger than 1. Here are two such factors, which suggests that the rating data represents two (independent) dimensions. (For those familiar with the method: I tried a few rotated solutions, but they yield similar results.) Now the first factor explains almost half of the variance at hand whereas the second factor has a much smaller Eigenvalue and subsequently explains only 1/8 of the variance in the data.

Let’s take a look at the so called factor loading to see how the two factor relate to the raters. Stata says:

Factor loadings (pattern matrix) and unique variances

---------------------------------------------
Variable |  Factor1   Factor2 |   Uniqueness
---------+--------------------+--------------
blue     |   0.6128   -0.0039 |      0.6244
mike     |   0.7690   -0.1880 |      0.3733
mitchell |   0.7188    0.1032 |      0.4727
glenn    |   0.7428   -0.0309 |      0.4474
randy    |   0.8830    0.0089 |      0.2202
kevin    |   0.7768    0.1219 |      0.3817
david    |   0.6764    0.3650 |      0.4092
ben      |  -0.0672    0.9439 |      0.1045
popvote  |   0.7512   -0.2534 |      0.3714
---------------------------------------------

Without going into statistical details, let’s say that the loading indicate who strongly each rater is related with each factor. For example, Blue’s ratings have less to do with the overall factor than Mike’s ratings. Both rater’s show rather high loadings, though. Given the high loading of all raters (except one) indicate a high level of general agreement. The only exception is Ben, whose ratings have little to do with the first factor. (You could argue that he even gave reverse ratings, but the loading is quite small.) Instead, his ratings play a big role in the second factor (which is by definition statistically independent from the first one). There is some agreement with the remaining variance of David’s ratings and a negative relationship with the popular vote (if you use the somewhat common notion to interpret loadings that are larger than 0.2). So there appears to be some dissent regarding the ranking. But on the other hand, the “dominant” first factor suggests that the ratings reflect the same construct to a large degree. Whether that’s song writing skills, mastering of the challenge, or simply sympathy, is different question.

PS: I must admit that I haven’t listened to all entries, yet. It’s a lot of music and I’m struggling with a few technical connection glitches. Anyway, I liked what Jason Morris and Alex Carpenter did, although their music wasn’t that happy. Another entry that necessarily caught my attention was Wake at the Sunnyside by the one and only Gödz Pöödlz. Not only did they choose the same topic I used, they also came up with a beautiful pop song and plenty of original lyrical ideas. Good work!